

MOIC (Multiple on Invested Capital) is a key metric for evaluating the efficiency and absolute value generated by your investments. This guide provides an in-depth look at accounting formulas, profitability, and how to combine ratios.

Among the most valued indicators in the accounting ecosystem, this ratio stands out for its ability to provide a direct assessment of capital efficiency.
In the realm of financial markets and private equity, this indicator represents an absolute multiplier of the contributions made by partners.
This financial ratio measures the strength of the total return relative to the initial outlay, reflecting an asset's raw power to generate absolute value.
Interpreting this ratio is straightforward. A value of 1x means you recover only your investment, with no profit or loss. With 2x, you double your initial capital, and with 3x, you triple it. If you obtain less than 1x, you are recording losses and recovering only a fraction of your funds.

Financial metrics guide companies and individual investors in making strategic day-to-day decisions.
Investment funds choose this indicator because it provides a snapshot of the actual money generated, eliminating the distortions introduced by the time factor. Entities require this data to verify the ability of management teams to effectively multiply capital.
The behavior of this ratio varies depending on the asset being analyzed. In private equity funds, it evaluates entire mature portfolios and verifies whether they meet the agreed-upon returns.
In the startup world, due to the high risk, you need to look for high multiples (greater than 5x or 10x) in the firms that survive. Finally, in corporate acquisitions, the ratio measures whether the purchase of a competitor generated the expected strategic return upon its sale.
This indicator serves as a test to measure the real value of your projects. If you restructure a company, improve operations, or increase sales, the final multiple reflects that progress. A constant increase confirms that your plans transform initial resources into valuable assets.
The basic mathematical structure of this indicator is defined by the relationship between the total value obtained and the capital contributed:
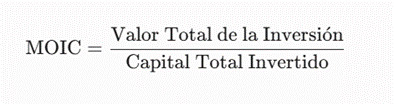
To delve into the components, the numerator is broken down into the sum of the current value of the assets that still remain in the portfolio.

Calculating this indicator is a straightforward process that you complete in five strategic steps:
By performing this division, you obtain a clear figure that summarizes the absolute success of your operation and provides the perfect basis for measuring your actual profitability.

If you calculate the impact of fees on the final result, you discover the actual, transparent return generated by your money.
While the gross indicator hides structural costs, the net indicator deducts management fees and performance incentives. This allows you to see the actual profit deposited into your account.
Although both metrics determine the profitability of a project, each focuses on different variables and offers complementary insights into capital performance.
You use the multiple when you need to know the absolute volume of value generated by your money; it is ideal for evaluating long-term project closures. Conversely, you apply the IRR when the time factor is critical and you need to measure the annual rate of return on cash flows.
The IRR calculates the time value of money and the opportunity cost, marking the actual pace of capital recovery. For this reason, doubling funds in two years generates a higher IRR than taking ten, even if the final multiple is identical.
The temporal discrepancy between both indicators is evident in this financial example:
This contrast demonstrates that if you evaluate your projects by focusing solely on the multiplier, you risk masking the poor temporal efficiency of your capital.
No professional analyst uses these metrics in isolation; investors combine them to broaden their perspective. A high multiple with a low IRR indicates a slow project that secures volume. The reverse scenario triggers a transaction that is fast in percentage terms but generates little actual profit.
Although this indicator provides clarity, it has structural blind spots that you must monitor closely to avoid incorrect assessments:
By recognizing these limitations and combining the multiple with time-based metrics, you ensure a clear and realistic view of your capital.
If you learn to interpret this indicator, you will immediately discover which assets are boosting or slowing down your portfolio.
When comparing different private equity funds, group the vehicles by their vintage year. This allows you to measure each manager's expertise under the same macroeconomic conditions and within the same market context.
This indicator reveals whether a manager delivers on their promises with tangible results or if they simply had a stroke of luck. By reviewing their historical multiples, you can determine if their successes are distributed consistently.
To obtain an impeccable financial overview, you must cross-reference information from these four key indicators:
By cross-referencing MOIC volume with IRR velocity and actual DPI liquidity, you fortify your analyses and make financial decisions fully backed by real data.
It means you have doubled your invested money. If you contribute an initial sum, you receive exactly double upon completion of the operation.
No, it ignores time entirely. It calculates the exact mathematical return regardless of whether the project took two months or an entire decade.
Gross measures direct asset gains. Net subtracts management fees and expenses, showing your final actual profit.
Yes, they function as synonyms. The former evaluates individual portfolio investments, while TVPI measures the overall performance of the fund.
A net multiple between 2x and 3x is a solid result. In venture capital, you demand more to compensate for the high probability of failure.
Traditional real estate requires significant capital. Domoblock revolutionizes this model, allowing you to invest 100% digitally starting from just €200. Through fractional real estate ownership, you participate in property appreciation with transparent metrics, while our team streamlines your financial diversification.
Mastering your financial metrics is key to enhancing the success of your portfolio. This indicator serves as a compass to measure the total volume of your capital. To safeguard your decisions, always evaluate the net multiple and combine it with the IRR and DPI; this will ensure real long-term returns.


.png)

Calle Pilar Mateo
Funded
100%
1.167.964,69€
Target
1.167.964,69€


.png)
.png)
.png)
.png)



.avif)
.avif)
.avif)


